Performance reports
Measure your AI Agent’s performance with a variety of detailed reports. This article outlines the individual reports, what they measure, and how the various filters work. Unless otherwise noted, you can view these reports by going to Performance > Reports in your Ada dashboard.
By default, these reports don’t include data from test users. That means that when you’re testing your AI Agent, you don’t have to worry about skewing your report results.
Learn about each report
Click a report name below to expand it and learn about the metrics it includes. Note that the reports that are available in your AI Agent may vary based on your Ada subscription. If you have any questions, don’t hesitate to contact your Ada team.
For more information on the filters you can use to refine your report data, see the Filter the data that appears in a report section of this page.
Actions usage
Provides visibility into how often Ada is performing each action, and highlights errors with full log download functionality - allowing your team to troubleshoot effectively. You can access this report through the Reports tab (under Performance) in the left navigation menu or directly through the report icon at the top of the Actions Hub.

Agent satisfaction score
View customer satisfaction (CSAT) surveys where the scores are attributed to human support, available if the “Automatically survey after chat” option is turned on.
When you filter this report by date, it uses the date that the user submitted their satisfaction survey, rather than the date the conversation started. As a result, the number of conversations that appear in this report may vary from other reports.
There are four ways you can set up customer satisfaction reviews, each with different scales for recording feedback:
Automated resolution rate
The automated resolution rate is an analysis of how many conversations your AI Agent was able to resolve automatically.
To calculate the automated resolution rate, your AI Agent analyzes each completed conversation to understand both the customer’s intent and the AI Agent’s response. Based on that analysis, it then assigns a classification of either Resolved or Not Resolved to each conversation.
For a conversation to be considered automatically resolved, the conversation must be:
-
Relevant - Ada effectively understood the customer’s inquiry, and provided directly related information or assistance.
-
Accurate - Ada provided correct, up-to-date information.
-
Safe - Ada interacted with the customer in a respectful manner and avoided engaging in topics that caused danger or harm.
-
Contained - Ada addressed the customer’s inquiry without having to hand them off to a human agent.
While Containment Rate can be a useful metric to get a quick glance of the proportion of AI Agent conversations that didn’t escalate to a human agent, automated resolution rate takes it a step further. By measuring the success of those conversations and the content they contain, you can get a much better idea of how helpful your AI Agent really is.
Your AI Agent will only assess for automated resolution when a conversation has ended. When viewing the automated resolution rate graph, a dotted line may appear to indicate that recent conversations may not have ended and therefore may cause the automated resolution rate to fluctuate once they’re analyzed. For more information on how the conversation lifecycle impacts automated resolution, see automated resolution rate.
In this list, you can view a summary of what each customer was looking for, how your AI Agent classified the conversation, and its reasoning. If you need more information, you can click a row to view the entire conversation transcript.
Average handle time
View the average amount of time customers spent talking with your AI Agent, for conversations that didn’t end in handoffs to human support.
This report uses winsorization on all of its metrics. To handle outliers, your AI Agent calculates the 90th percentile of all handle times. If a handle time is higher than the 90th percentile limit, your AI Agent replaces it with the 90th percentile limit instead.

Containment rate
View how often customers were able to self-serve instead of escalating to human support.

Conversational messages volume
View the number of AI Agent, customer, and human agent messages per conversation.
Example conversation:
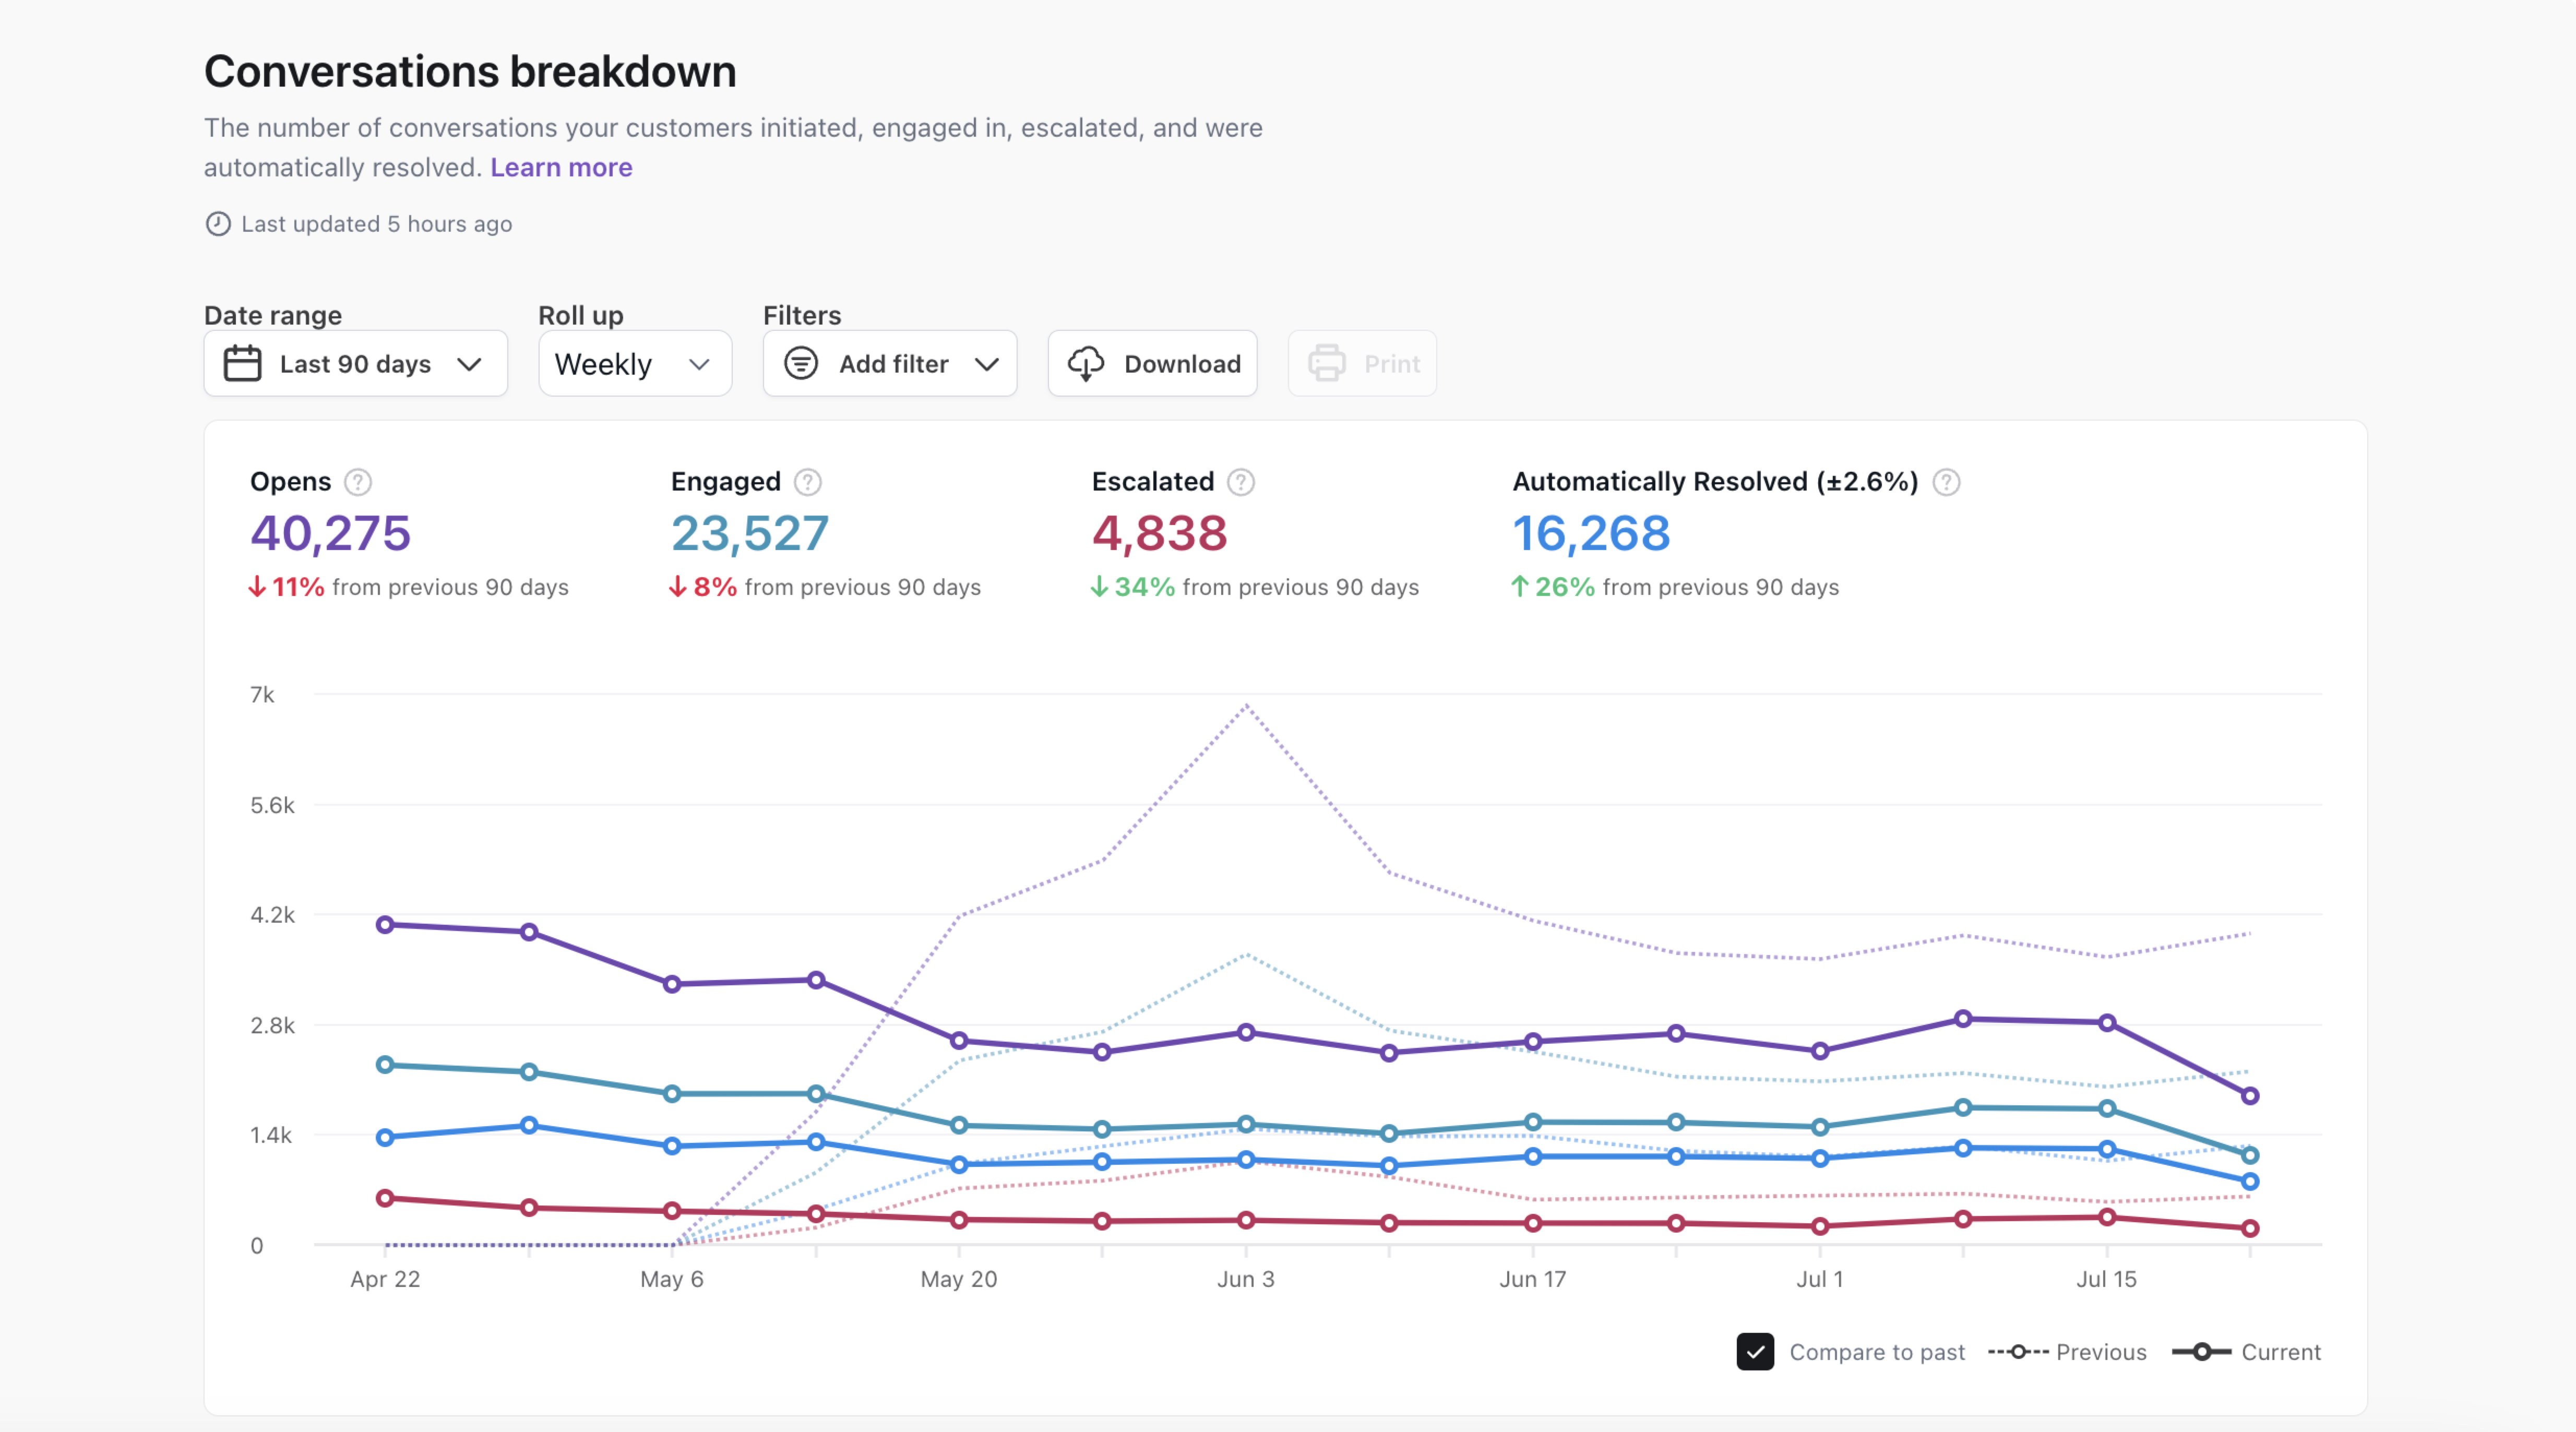
Conversations breakdown
View the number of conversations initiated, engaged, and escalated in your AI Agent.
Customer satisfaction score
View the percent of your AI Agent’s conversations that customers reviewed positively. For more information, see Collect and analyze customer satisfaction data with Satisfaction Surveys.
There are four ways you can set up customer satisfaction reviews, each with different scales for recording feedback:
Knowledge usage
View to help you understand which articles are most frequently used by Ada in customer responses, and which articles are correlated with high or low Automated Resolution Rates as well as other performance metrics. Includes conversation drill-throughs to support improvement workflows. You can access this report through the Reports tab (under Performance) in the left navigation menu or directly through the report icon at the top of the Knowledge Hub.

Satisfaction survey results
View the results of your customer satisfaction (CSAT) survey. For more information, see Collect and analyze customer satisfaction data with Satisfaction Surveys.
When you filter this report by date, it uses the date that the user submitted their satisfaction survey, rather than the date the conversation started. As a result, the number of conversations that appear in this report may vary from other reports.
There are four ways you can set up customer satisfaction reviews, each with different scales for recording feedback:

Filter the data that appears in a report
Filter data by date
To filter a report by date:
-
Click the date filter drop-down.
-
Define your date range by one of the following:
-
Select a predefined range from the list on the left.
-
Type the filter start date in the Starting field. Type the filter end date in the Ending field.
-
Click the starting date on the calendar on the left, and the ending date on the calendar on the right.
-
-
Click Apply.
The date filter dropdown provides you with the ability to specify the date range you want to filter the report’s data by. You can select from a list of preset date ranges or select Custom… to specify your own by way of a calendar selector.
Filter data by additional criteria
The list of available filters differs for each report, depending on the data the report includes. Clicking the Add Filter drop-down menu gives you access to the filters relevant to the report you’re viewing.
-
Include test user: Include conversations originating from the Ada dashboard test AI Agent. Test conversations are excluded by default.
-
Action: View conversations relevant only to specific Action(s).
-
Status code: View reporting analytics relevant to API calls with a specific error code type (e.g. 1xx, 2xx, 3xx).
-
Article source: View conversations that referenced articles from a specific source.
-
AR classification: The automatic resolution classification for the conversation.
-
CSAT: The customer satisfaction rating the customer gave the conversation.
-
Conversation topic: The topic your AI Agent automatically assigned to the conversation.
-
Conversation category: The category that the assigned conversation topic has been manually grouped under.
-
Engaged: Conversations where a customer sent at least one message to your AI Agent.
-
Handoff: Conversations where your customer was handed off to a human agent.
-
Language (if Multilingual feature enabled): Include/exclude volume of different languages if your AI Agent has content in other languages.
-
Channel: Isolate different platforms that your AI Agent is visible in or interacts with (for example, Ada Web Chat, SMS, WhatsApp, etc.).
-
Browser: Isolate users from specific internet browsers (for example, Chrome, Firefox, Safari, etc.).
-
Device: Isolate users from specific devices and operating systems (for example, Windows, iPhone, Android, etc.).
-
Filter by variable: View only the conversations which include one or more variables. For each variable, you can define specific content the variable must contain, or simply whether the variable Is Set or Is Not Set with any data.
Additional information
-
Report data is updated approximately every hour (but may take up to three hours).
-
Reports are in the time zone set in your profile.
Printing
We recommend viewing your AI Agent’s data in the dashboard for the best experience. However, if you need to save the report as a PDF or print it physically, use the following recommendations to limit rendering issues:
-
Click Print.
-
In the Print window that appears, beside Destination, select either Save as PDF or a printer.
-
Click More settings to display additional print settings.
-
Set Margins to Minimum.
-
Set Scale to Custom, then change the value to 70.
- Alternatively, you can set the Paper size to A3 (11-3/4 x 16-1/2 in) or Legal (8.5 x 14 in).
-
Under Options, select the Background graphics checkbox.
-
Right before saving or printing, scroll through your print preview, and beside Pages, change the number of pages you want to include in your PDF or printout. The settings you changed above may affect how these pages render.
-
If your destination is Save as PDF, click Save. If your destination is a printer, click Print.